
Tracking AST SpaceMobile Satellites in Real Time
A hands-on look at tracking AST SpaceMobile BlueBird satellites in real time using HTML, JavaScript, and live TLE data.
(Because Static Data Is Boring)
I spend a lot of time messing with things that move in real time — servers, networks, dashboards, homelabs, live stats — so staring at static satellite tables never really did it for me.
I wanted something visual. Something live. Something I could drop straight into my Ghost CMS and just… watch.
So I built a browser-only satellite tracker that shows AST SpaceMobile’s BlueBird satellites (1–5) flying around a 3D Earth in real time, using nothing but HTML, CSS, and JavaScript.
No backend. No APIs I control. Just public orbital data and a bit of math.
How Satellite Tracking Actually Works (At a High Level)
At first glance, satellite tracking feels like it should require NASA-level tooling. In reality, it boils down to three parts:
- Orbital data – where the satellite should be
- Propagation math – figuring out where it is right now
- Visualization – turning numbers into something human-readable
This project handles those with:
- TLEs (Two-Line Elements) for orbit data
- satellite.js to do the orbital math
- globe.gl to render everything on a 3D Earth
All of it runs directly in the browser.
Where the Orbit Data Comes From (TLEs)
Satellites publish something called a Two-Line Element set. It’s basically a compact snapshot of the satellite’s orbit.
It looks like nonsense at first glance:
1 61047U 24163C 25355.52232882 .00004475 00000-0 21314-3 0 9990
2 61047 52.9735 46.3871 0007921 318.2181 41.8208 15.21079586 70726
But those two lines contain everything needed to predict the satellite’s position at any moment in time.
I pull live TLEs from CelesTrak using the satellite’s NORAD ID — the same way a lot of professional tracking tools do.
Built-In Fallbacks (Because the Internet Is Unreliable)
Because this lives inside Ghost CMS — and because ad blockers, CORS, and flaky networks exist — I didn’t want the whole thing to fail if TLE fetching breaks.
So I embed a fallback copy of the TLEs directly in the script:
const EMBEDDED_TLES = new Map([ [61047, [ "1 61047U 24163C ...", "2 61047 52.9735 ..."
]]
]);
If live fetching fails, it silently falls back to these. The globe still loads, satellites still move, and the UI tells you what source is being used.
This is very much a homelab mindset decision: build it so it keeps working even when parts fail.
Turning Orbits into Latitude & Longitude
TLEs don’t give you latitude and longitude directly. They describe an orbit in space.
To turn that into something usable, the script:
- Propagates the orbit to the current time
- Converts space coordinates into Earth-relative coordinates
- Adjusts for Earth’s rotation
That all happens locally using satellite.js.
Here’s the core idea:
const pv = satellite.propagate(satrec, new Date());const geo = satellite.eciToGeodetic(pv.position, gmst);
At that point, I have:
- Latitude
- Longitude
- Altitude above Earth
That’s all the globe renderer needs.
Rendering the Earth (The Fun Part)
The visualization uses globe.gl, which is basically Three.js without the headache.
I give it:
- An Earth texture
- A bump map for terrain depth
- A subtle atmosphere
- A list of satellite points that update constantly
globe .pointsData(points) .pointLat(d => d.lat) .pointLng(d => d.lng) .pointAltitude(d => d.alt) .pointRadius(d => d.size);
Every ~200ms, the satellites move. No page refresh. No reload. Just motion.
This scratches the same itch as watching live network graphs or disk activity dashboards — it’s alive.
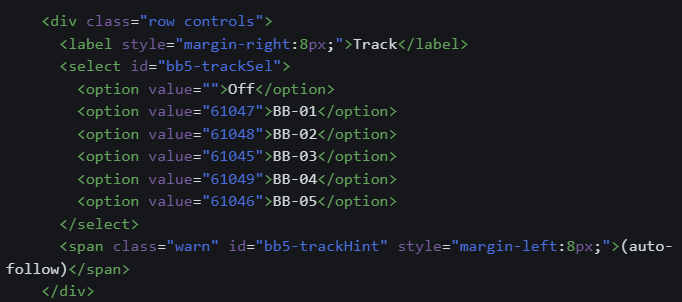
The Control Panel (HUD)
I built the UI as a floating HUD layered over the globe. It’s just HTML and CSS, but it includes:
- Live library status
- TLE source and update time
- Satellite enable/disable toggles
- Auto-tracking for a single satellite
- Adjustable point size
- Recenter and refresh buttons
- A stats panel with altitude, speed, and orbital period
One thing I’m weirdly proud of:
the HUD doesn’t block globe interaction unless you’re actually clicking a control.
That took a bit of pointer-event juggling, but it makes the whole thing feel smooth instead of clunky.
Auto-Tracking Without Being Annoying
Auto-tracking sounds cool until it fights your mouse.
So the script watches for user interaction:
- If you’re dragging or zooming → auto-tracking pauses
- When you stop → it smoothly resumes following the selected satellite
This is the same philosophy I use in dashboards and monitoring tools:
assist the user, don’t wrestle them.
Making It Work on Mobile (Without Covering the Earth)
On phones, screen space disappears fast. The fix was simple but intentional:
- Dock the HUD to the bottom
- Reserve space so the globe never renders underneath it
- Hide the heavy stats by default
- Let a “Details” button toggle them
It’s compact, readable, and still interactive — which matters when you’re inevitably checking this from your phone.